
Explore the Content:
- The Rental Profitability Calculator
- How to Read Your Results
- Understanding the 5 Key Metrics
- Interpreting Your Score: What is a "Good" ROI?
- The "Break-Even" Point: Why It Matters
- Three Ways to Improve Your Rental ROI
- Summary: Data-Driven Decisions Win
The most common trap in the rental industry has a name: Gear Acquisition Syndrome. It's the belief that more inventory automatically means more profit. It doesn't.
Revenue (money coming in) is not the same as Profit (money you keep). Too many rental business owners confuse the two — running "napkin math" that looks like a win on paper, but quietly bleeds cash once maintenance, storage, cleaning, and slow months are factored in.
Successful rental entrepreneurs don't guess. They calculate.
This guide gives you a free rental ROI calculator, explains every metric behind it, and shows you exactly how to use the results to make smarter purchasing decisions and grow a more profitable rental business.
The Rental Profitability Calculator
Use the sliders in the calculator to test different pricing, utilization, and cost scenarios. See how your profit changes when you adjust the daily rate or increase your utilization rate.
Rental Profitability Calculator
Use the sliders to test pricing, utilization, and cost scenarios — watch your ROI update instantly.
Calculator Inputs
| Timeline | Revenue | Op. Profit |
|---|---|---|
| Monthly | $390 | $380 |
| Year 1 | $4,680 | $4,560 |
| Lifetime | $14,040 | $12,480 |
How to Read Your Results
The calculator returns two core outputs that tell the most important story about any piece of rental inventory:
Annual ROI expresses your net return as a percentage of the initial purchase price over a full year. A higher ROI means you recover your investment faster and generate more surplus income from the same asset.
Break-Even Point shows the exact month when your accumulated rental revenue surpasses everything you've spent — the purchase price plus all maintenance costs to date. Before that month, you're in the hole. After it, every rental is pure profit against a fully recouped asset.
Read these two numbers together. A high annual ROI with a long break-even window may signal high upkeep costs eating into gains. A low ROI with a short break-even point may mean the item is a low-margin workhorse that ties up capital quickly — great for volume, less useful for diversification.
Understanding the 5 Key Metrics
1. Asset Purchase Price
This is not just the sticker price. Your true purchase price is the full "Rental Ready" cost — every dollar you spend before the item earns its first dollar back.
That means including:
- Shipping and freight
- Sales tax
- Protective cases, covers, or carrying bags
- Assembly labor or installation fees
- Any modifications needed for safe rental use
Underestimating your purchase price is one of the most common causes of ROI miscalculation. If you paid $800 for a piece of equipment but spent another $150 getting it rental-ready, your real starting cost is $950.
Pro tip: Research resale value before you buy. If you can sell the item for $400 after three years of use, your effective net purchase price is only $550. Factor that into your lifetime ROI calculation.
2. Daily Rental Rate
Your daily rental rate is the single most important pricing decision you make for each item. Set it too low and you'll never recover your investment. Set it too high and the item sits idle.
Competitive analysis is not optional here. Before finalizing a rate, research:
- What comparable items rent for in your market
- Whether your item has features that justify a premium
- How seasonal demand affects pricing throughout the year
- Whether hourly, half-day, or multi-day rate structures would increase total revenue per rental
A well-researched pricing strategy increases your ROI without any additional inventory investment.
3. Utilization (Days Rented per Month)
Utilization is the single biggest factor in determining profitability. An item with a mediocre daily rate but high utilization will almost always outperform an item with a premium rate that sits idle half the month.
Real-world utilization benchmarks vary significantly by category:
- Weekend-heavy items (party tents, inflatables, bounce houses): average 6–10 days per month
- Daily-use items (tools, AV equipment, bikes): can reach 10–18 days per month in season
- Seasonal items (holiday decor, outdoor furniture): may average 3–5 days per month across a full year
Be honest with your utilization estimates. Using your best-month numbers instead of your annual average is the fastest way to fool yourself into a bad purchase.
4. Maintenance & Overhead
Every item you own costs you money even when it's not being rented. These ongoing costs erode profit whether or not the equipment is out on a job.
Factor in all relevant upkeep costs:
- Storage space allocation (what percentage of your facility cost does this item use?)
- Cleaning supplies and labor time after each rental
- Routine maintenance and inspection costs
- Repair parts and occasional professional servicing
- Software and admin time to list, manage, and track the item
- Insurance allocation for the specific item
Rental businesses that ignore maintenance costs in their ROI calculations routinely discover that a "profitable" item is actually running at a loss once all costs are accounted for.
5. Expected Lifetime (Years)
Expected lifetime is the rental lifespan of the item — not how long it will physically survive in your warehouse, but how long it will remain:
- Safe to rent under frequent use
- Functional without chronic repair cycles
- Marketable to customers who increasingly expect modern, quality equipment
A tent might physically last 15 years, but if the fabric looks worn and stained after 6 years of heavy use, its effective rental lifetime for your ROI calculation is 6 years — not 15.
High-frequency rentals (daily-use tools, party inflatables) typically have shorter rental lifetimes than low-frequency specialty items. Build in realistic depreciation when setting your lifetime estimate.
Interpreting Your Score: What is a "Good" ROI?

Not all ROI scores are created equal. Context matters enormously — a 30% ROI on a $50,000 excavator represents very different business math than a 30% ROI on a $200 folding table set.
Here's a practical framework for interpreting your results:
Slow Return (0–40% Annual ROI)
These are typically long-payback investments — expensive machinery, specialty equipment, or items with high maintenance costs relative to their rental rate. Cash recovery takes 2–4+ years. This isn't automatically bad, but it ties up capital and leaves you vulnerable to obsolescence, damage, or demand shifts before you recoup your investment.
Strategy: Bundle these items with accessories or services to increase effective revenue per rental. A tent that rents for $300 alone might generate $550 when bundled with lighting, sidewalls, and delivery.
Solid Performance (40–100% Annual ROI)
This is the industry standard sweet spot. Your asset pays for itself within year one and generates healthy margins. This range is where most well-run party, AV, and event rental items land when priced and utilized correctly.
Excellent Investment (100–300% Annual ROI)
These are your star performers — items that pay for themselves within 4–6 months and generate substantial profit for years afterward. Common examples include professional AV equipment, event tents, party inflatables, and specialty décor in high-demand markets.
At this ROI level, the primary risk isn't profitability — it's capacity. Not having enough of these items often costs more than owning too many.
Unicorn Status (300%+ Annual ROI)
Rare but real. These items typically share two characteristics: a low purchase price relative to their rental rate, and consistent demand. Examples often include cables and adapters, linens, damage waivers sold as add-ons, and small but essential accessories.
Don't build a business exclusively on unicorn items — they're often commodities and easy for competitors to copy — but identify them in your catalog and protect your supply.
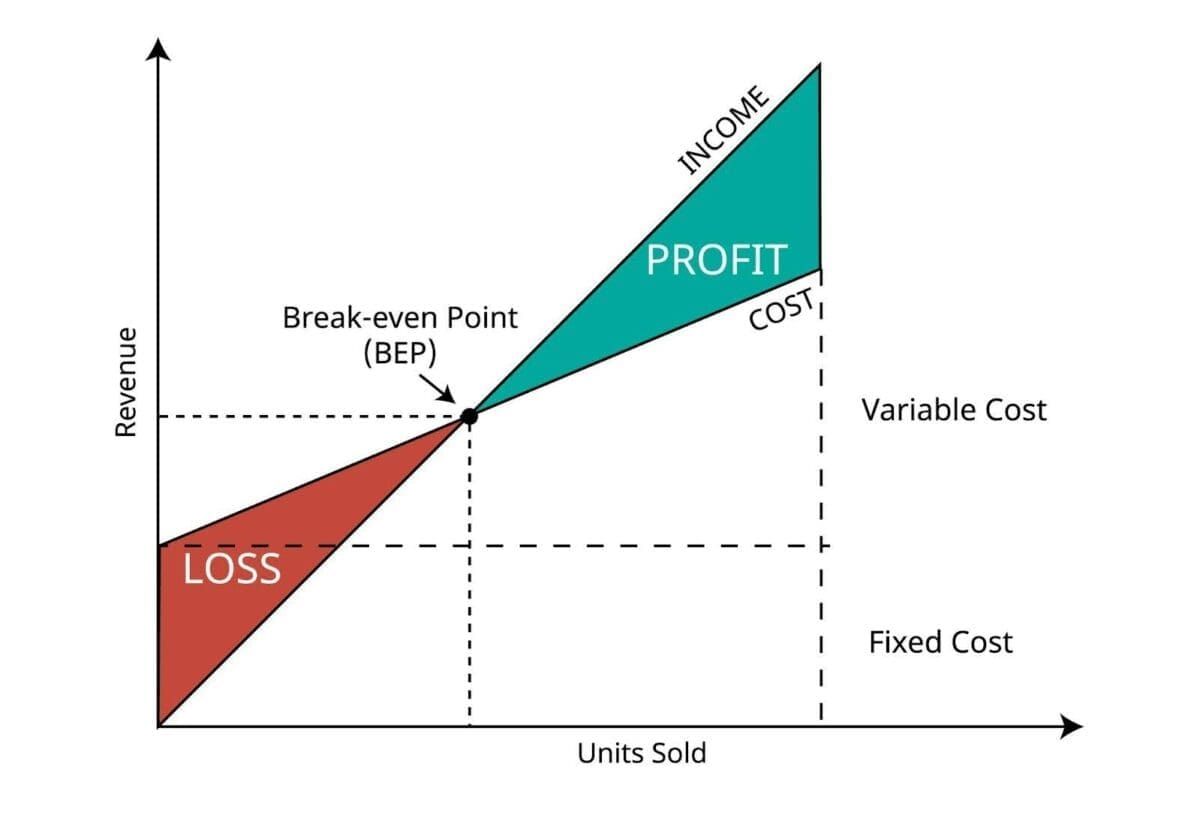
The "Break-Even" Point: Why It Matters
The break-even month is the moment your rental investment transitions from a liability on your balance sheet to a productive, self-sustaining asset.
Before break-even: Every dollar of damage, every month of unexpected low utilization, and every repair bill comes directly out of your pocket. You're exposed.
After break-even: The item is fully paid for. Ongoing revenue is nearly pure profit (minus maintenance). You have flexibility to replace it, sell it, or run it until it fails without financial anxiety.
The recommended target: a 6–12 month break-even window.
Why? Two reasons:
- Obsolescence risk. Rental equipment trends shift. What's in demand today may be outdated in 18–24 months. Items with a 3-year break-even leave you exposed to market changes before you've recovered your money.
- Damage exposure. The longer it takes to break even, the longer you're carrying unrecovered capital at risk of accidental loss.
If the calculator shows a break-even point beyond 18 months, revisit your pricing, your utilization assumptions, or the purchase price itself. Consider whether the item is actually worth buying, or whether a vendor partnership or dropship model might reduce your risk.
Three Ways to Improve Your Rental ROI
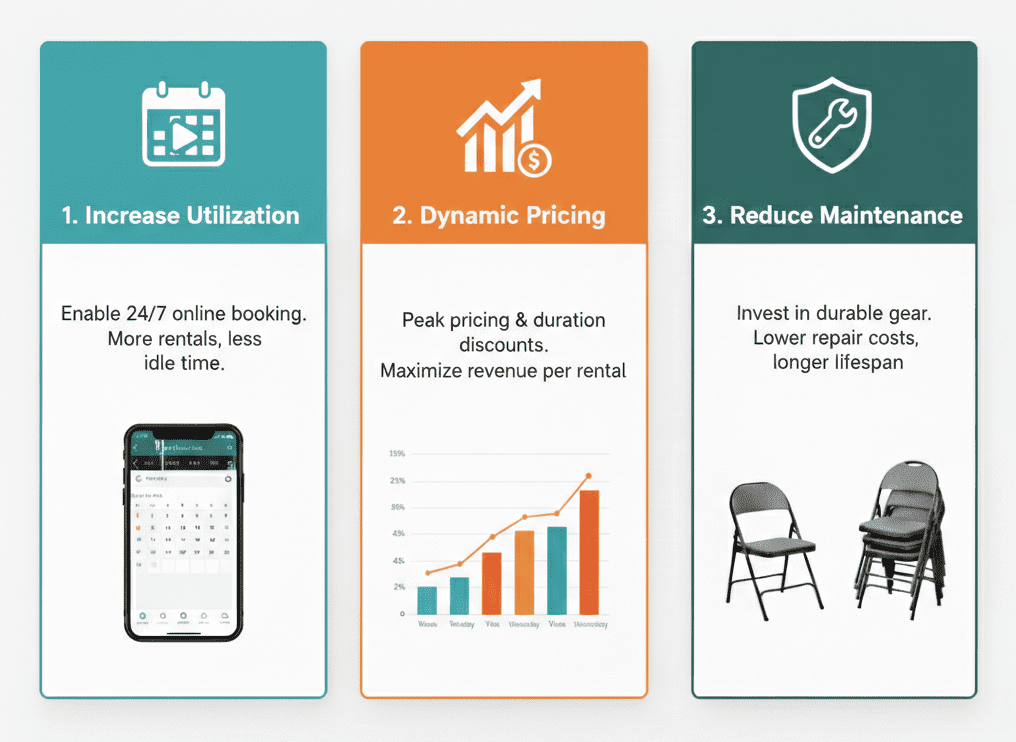
1. Increase Utilization (The Most Effective Lever)
Run the calculator and change your days-rented input from 8 to 9 — just one additional rental day per month. For most mid-range rental items, that single day of additional utilization increases your annual operating profit by 10–15%. For expensive items, the impact is even more dramatic.
The most effective way to increase utilization is to remove booking friction. Customers who can't find your availability online, can't book at 11 PM, or have to call to confirm pricing will simply rent from whoever makes it easiest.
24/7 online booking availability is not optional for rental businesses that want to maximize utilization. RentMy lets customers find open dates, reserve items, pay deposits, and sign agreements without any manual intervention from your team — unlocking rental revenue during every hour you're not in the office.
2. Dynamic Pricing
Your daily rental rate does not have to be fixed. Dynamic pricing — adjusting rates based on demand, season, or booking lead time — is one of the most underused profit levers in the rental industry.
Peak pricing: Increase rates during predictable high-demand periods (holidays, spring/summer event season, local festivals). Customers expect seasonal pricing and will pay it for availability.
Duration discounts: Offer a reduced daily rate for 3-day, weekly, or weekend rentals. Lower per-day revenue is more than offset by reduced logistics costs (fewer deliveries, fewer changeovers) and higher total revenue per transaction.
Last-minute availability pricing: Consider modest discounts for items that would otherwise sit idle during low-demand periods. Some revenue is always better than zero, as long as it doesn't undercut your market positioning.
3. Reduce Maintenance Costs
Maintenance costs compound over the life of an asset. Shaving 20% off your monthly upkeep cost has the same effect on lifetime ROI as increasing your daily rental rate by a meaningful margin.
The most effective way to reduce long-term maintenance costs is counterintuitive: buy better equipment upfront.
Higher-quality inventory (commercial-grade chairs versus residential, professional-grade tools versus consumer) typically costs more at purchase but yields dramatically lower repair rates, longer rental lifetimes, and better customer satisfaction scores — all of which improve your calculated ROI.
Specific examples: commercial-grade folding chairs rated for 500+ lb loads last 3–4x longer in rental service than economy alternatives; professional power tools with brushless motors require significantly less maintenance than their consumer counterparts.
The calculator makes this tradeoff quantifiable. Run two scenarios side by side — a $400 economy item versus an $800 commercial item — with realistic differences in lifetime and monthly upkeep. The result often surprises business owners who assumed the cheaper option was the better investment.
Summary: Data-Driven Decisions Win
Numbers don't lie. Before you swipe your card for that next piece of inventory, run the calculations.
The rental businesses that consistently outperform their markets are not the ones with the most equipment — they're the ones who know exactly which items earn their keep and which items just take up space. They price with confidence, invest with precision, and optimize utilization without guessing.
Use this calculator every time you consider a new purchase. Track your real-world utilization monthly and compare it to your estimates. When the numbers diverge, adjust — either your pricing, your utilization strategy, or your decision to keep the item at all.